How safe is my neighborhood? Google Street View knows!

Hi all!
Alarming statistics have been popping up lately around the growth in crime in the U.S. Six large cities (including NYC and LA), and have already (as of June) surpassed their violent crime levels from last year - which itself was a record year. The Commonwealth of Virginia reported that violent crime is up 7% statewide since last year. And public transit agencies are likewise reporting growth in violent crime in their systems.
These objective measures of criminal activities are useful to track, but perceptions matter, too. If a city is perceived as unsafe, people are less likely to visit, shop, or invest there. What about urban planners, how do they consider perceptions of safety in deciding where to focus planning interventions like new bus stops, parks, or housing developments?
With a grant from the Government of Quebec, me and my team of students at Tufts University explored these questions and started with two cities in Canada: Toronto and Montreal. We began by cataloguing all of the transportation planning these cities have undertaken over the last decade. Next we borrowed data output from a survey that MIT researchers had used where they asked people to look at images of urban scenes in Boston and vote on which one looked safer.
We fed those human responses into an advanced form of computer model that allowed the machine to learn from the Boston data and teach itself to recognize when an image of an urban scene looked safe or not. The results were amazing. The computer was able to tell the difference between places that actual people had considered safe vs. plces where people had said were not safe, in both Toronto and Montreal!

We then mapped those results and compared it with where transportation planning was happening in each city and saw meaningful patterns emerge. There was a statistically significant relationship between those places where the model tells us look unsafe and where transportation investments were being planned for.

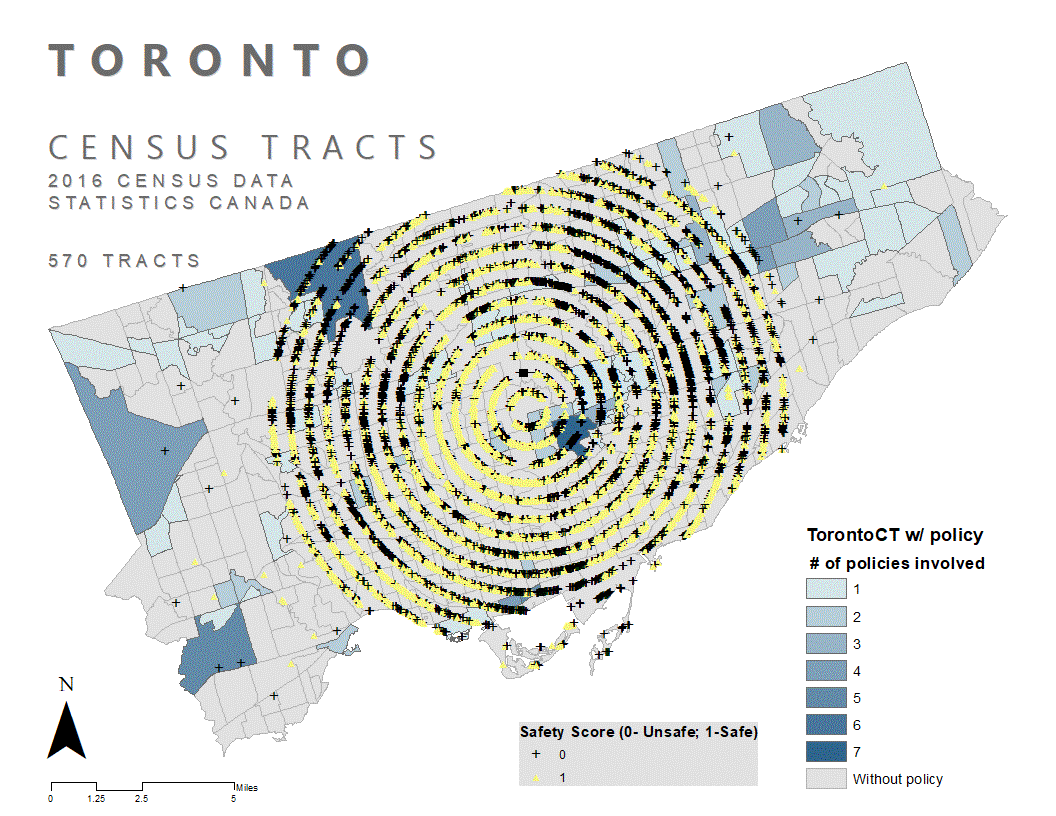
A key limitation of this research is that we did not conduct interviews with planners, so we really don’t know the causal direction. It seems to make sense here that planners are focusing on parts of the city that are perceived as unsafe, but our methods don’t allow us to assert that. All we do know for sure is that Google Street View, along with machine learning techniques, can help planners understand the relationship between safety perception and their planning – hopefully this research will highlight for city officials which parts of their communities are perceived as unsafe and guide them in making transportation and other investments to address those concerns.
Hope you enjoyed this post. If you did, please like and share widely!
Best,
Justin
_________________________________________________
You can read the full article here:
Hollander, Justin B., Giorgi Nikolaishvili, Alphonsus A. Adu-Bredu, Minyu Situ, and Shabnam Bista. 2021. Using deep learning to examine the correlation between transportation planning and perceived safety of the built environment. Environment and Planning B: Urban Analytics and City Science 48, 7: 2023-2038.
https://journals.sagepub.com/doi/abs/10.1177/2399808320959079?journalCode=epbb